This project is an interactive Power BI dashboard built using the Northwind dataset to analyze sales performance and operational insights.
The dashboard is designed to help decision-makers:
- Monitor business performance
- Identify trends and patterns
- Detect operational inefficiencies
- Make data-driven decisions
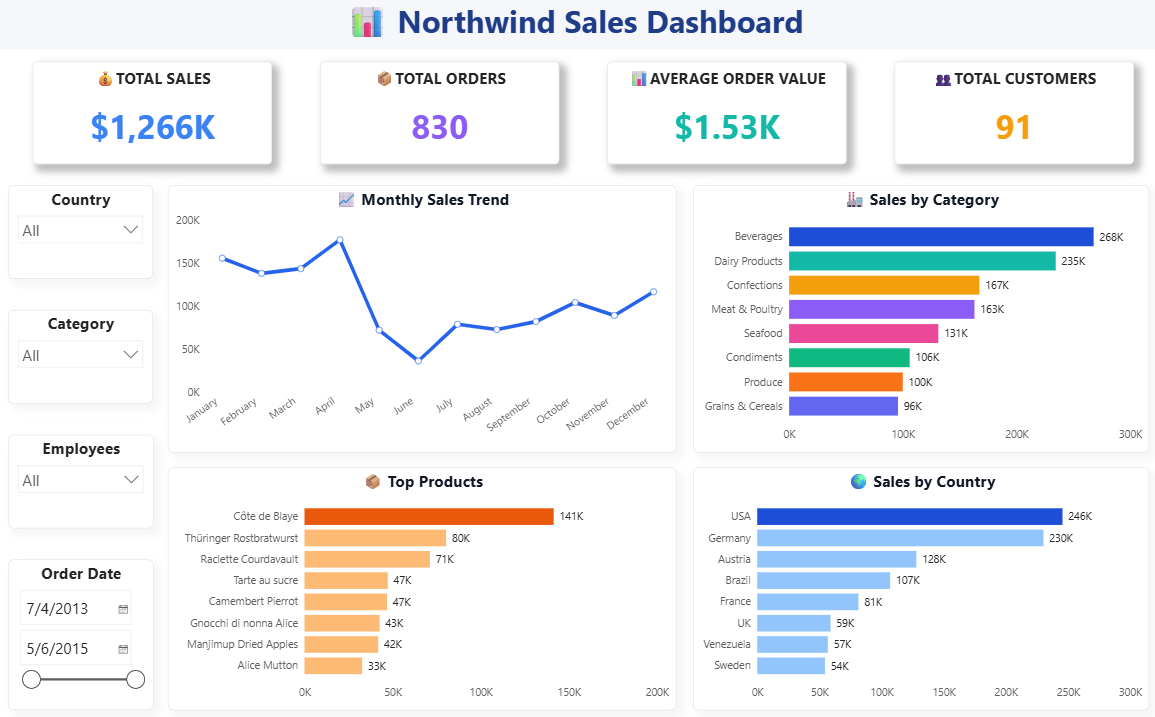
This page provides a high-level summary of business performance for quick decision-making.
🔹 Key Features:
💰 KPI Cards
- Total Sales
- Total Orders
- Average Order Value
- Total Customers
📈 Monthly Sales Trend
- Shows sales performance over time
- Helps identify growth and seasonal patterns
📊 Sales by Category
- Multi-color visualization for category comparison
- Highlights top-performing product categories
🌍 Sales by Country
- Displays geographical sales distribution
- Identifies top contributing regions
🥇 Top Products
- Highlights best-selling products
- Helps understand product-level performance
🎛️ Filters (Slicers)
- Country
- Category
- Employees
- Order Date
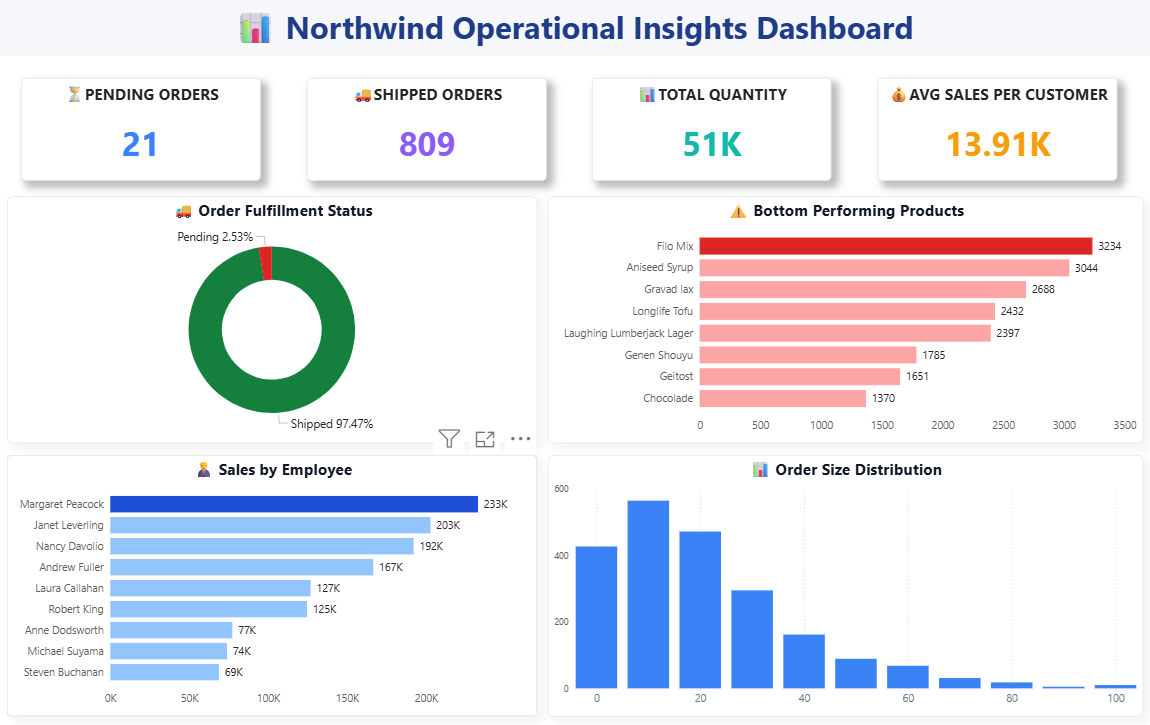
This page focuses on operational performance and problem identification.
🔹 Key Features:
🚨 KPI Cards
- Pending Orders
- Shipped Orders
- Total Quantity
- Avg Sales per Customer
🚚 Order Fulfillment Status
- Donut chart showing Pending vs Shipped orders
- Provides quick view of operational efficiency
⚠ Bottom Performing Products
- Identifies low-performing products
- Helps in decision-making for improvement or removal
👨💼 Sales by Employee
- Compares employee performance
- Highlights top and low performers
📊 Order Size Distribution
- Shows distribution of order quantities
- Helps understand customer buying patterns
🔍 Operational Focus
- Identifies inefficiencies in order processing
- Highlights areas needing attention
- What is the overall sales performance of the business?
- Which products and categories generate the most revenue?
- Which countries contribute the highest sales?
- Who are the top-performing employees?
- What percentage of orders are successfully shipped?
- Which products are underperforming?
- What is the distribution of order sizes?
- Where are operational inefficiencies occurring?
- Power BI
- DAX (Data Analysis Expressions)
- Data Modeling
- Data Visualization
- Dashboard Design
- Business Analysis
- Data Modeling
- KPI Development
- Insight Generation
- Clean white background with modern UI
- Consistent color palette for KPIs
- Multi-color category analysis
- Highlighted key insights using visual hierarchy
- Interactive filters for dynamic analysis
This dashboard provides a complete 360° view of business performance, combining both strategic and operational insights.
It enables stakeholders to:
- Track performance
- Identify trends
- Detect issues
- Make informed business decisions
⭐ If you like this project, feel free to give it a star!