Replies: 3 comments
-
|
There is no easy answer to "why is usage high". The framework indeed caches objects for re-use, but it does not account for the whole picture. Your program/system allocator is likely holding on to blocks of memory for re-use, too. |
Beta Was this translation helpful? Give feedback.
-
|
Do you try to use jemalloc as allocator? I have the same issue about memory consume (always increase and never reclaim this). After I add jemalloc as allocator, app always consume the same memory size. |
Beta Was this translation helpful? Give feedback.
-
|
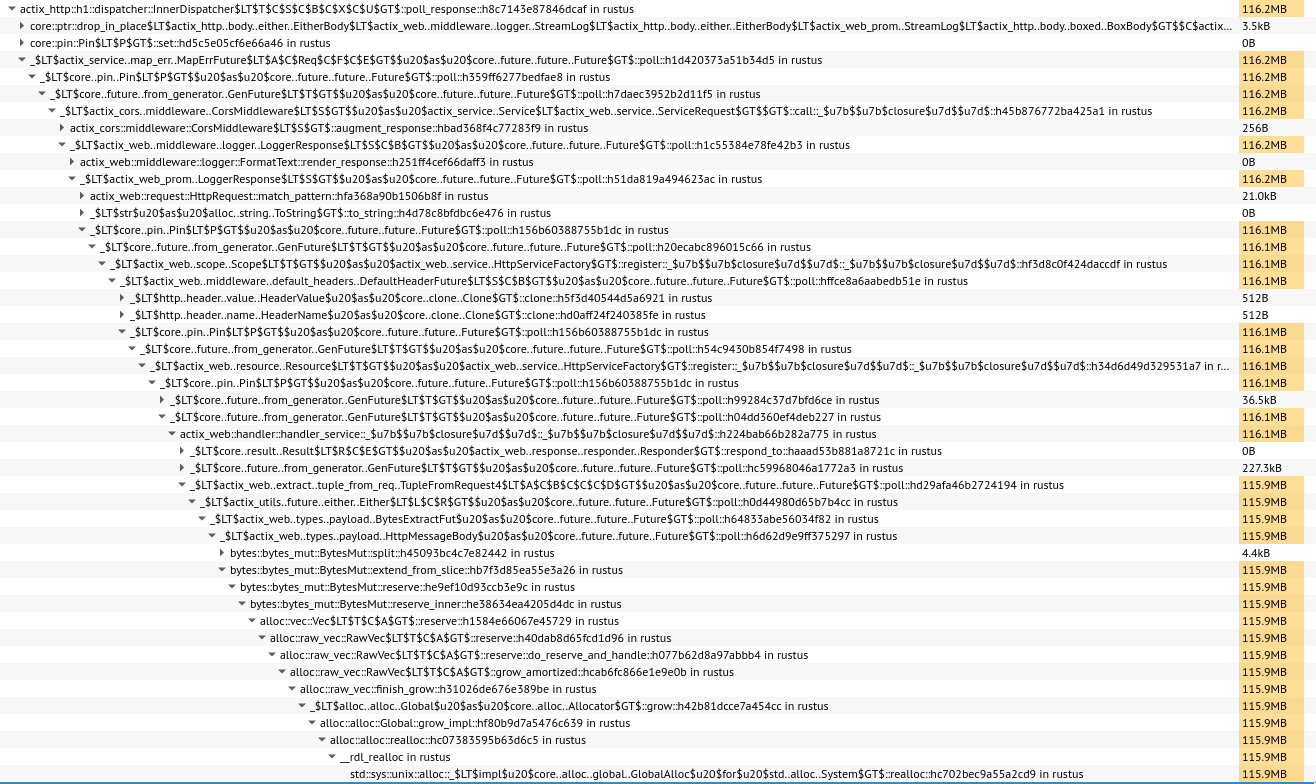
I ran heaptrack to find leaks and I guess I found it. After killing the program with
Full stack trace gave me more information. I guess it's an issue of a bytes' crate or misuse of the Full heaptrack report: |

Beta Was this translation helpful? Give feedback.
Uh oh!
There was an error while loading. Please reload this page.
Uh oh!
There was an error while loading. Please reload this page.
-
Hi to everyone. I have a problem with memory usage. It doesn't look like a leak, but more like internal caches or something.
I'm developing TUS protocol implementation and I've chosen actix-web as a framework. It's really nice but memory usage is high and I can't get over this issue.
Here are some charts of load testing:
As you can see, when the number of active connections (opened file descriptors) grows, memory usage goes up. When number of active connections decreases, memory usage is the same. And only when all connections are closed memory usage goes down, but it doesn't return to the same value at the start of load testing.
Also, I'm interested why after some warmup connections the minimal amount of memory used by my application is about 200MB. Isn't it high?
I have some ideas but I can't really find a answer.
Boxes in state
I use Boxes with dynamic traits as a state. My state is defined like this:
Also
StorageandInfoStoragetraits are using the#[async_trait]annotation.Too many blocking tasks
I use
spawn_blockingfor writing and reading files to make the app faster since tokio::fs is not so fast.So basically at almost all requests, I call something like this:
I write lots of bytes
TUS is a protocol for file uploads. Maybe memory consumption is huge because I use a bytes extractor and move bytes to sync closure with
spawn_blocking. But, as the documentation says, bytes cloning must be cheap.Source code of a project: https://github.com/s3rius/rustus
P.S. Of course, I understand that I'm doing something wrong and this behavior is the result of my code. But I would appreciate some help in finding the root cause.
Script for recording process info:
To run it simply install dependencies and run like this:
pip install psutil matplotlib
python ./script.py --pid "<pid>"
Beta Was this translation helpful? Give feedback.
All reactions